Get the Facts: Which states top childcare cost rankings?
It just seems to be outrageous. 3 or 4 months of our mortgage, that’s about half my paychecks. Childcare costs were up an additional 5% last year, growing faster than inflation, according to the Bureau of Labor Statistics. Childcare still remains persistently high, and it’s *** cost *** lot of families can’t. Be flexible on. And there’s *** deeper problem. Providers are trapped in *** bind. They can’t charge families the true cost of care without pricing them out further, which forces them to pay early educators low wages that fuels high turnover and *** chronic lack of available centers. All of these challenges can look different depending on where you live, which is why we checked in with our team of Hearst reporters across the country. Here in the South, it’s not just the cost for families, it’s also the access. The Buffett Early Childhood Institute, they said that nearly 129,000 children in Florida lack access to childcare within *** reasonable distance. Parents are traveling quite far, 45 minutes, 50 minutes. The gap is especially felt here in Florida’s 21st congressional district. The child care gap is third highest in the state. We have over 100 children on our waitlist, and because we only have 9 classrooms, it’s really hard to be able to get those children off the waitlist as fast as the parents need so that they can go back to work. In Milwaukee, childcare may be easier to find, but it eats up *** significant portion of parents’ incomes. Well, I was doing the math and it is definitely double our mortgage amount, so I think once you add in healthcare insurance, daycare, mortgage, you’re not left with *** lot. Federal data shows parents are spending anywhere from 8 to 16% of their income. On care for just one child, I do see with other families if they can’t go to the grocery store, they need to pay for their childcare. For some lower income families, the impact is even more severe as more income gets directed to childcare. I would say in another couple of months it’d probably get pretty tight and we might have to look at savings. In 2023, New Hampshire families with two children paid $32,000 annually. That’s 28% of median family income. Right now I’m lucky enough to have obtained *** voucher through the Department of DHHS out of New Hampshire. On average, it is still $350 to 450 cents *** week for childcare. That’s about half my pay. Checks. We don’t have like the newest, best stuff. Our cars are pre-owned. We like to thrift *** lot of the kids’ clothes, and these rising costs are reshaping the workforce. More parents, particularly mothers, are being forced to choose between childcare, cutting back hours, or leaving their job altogether. It just didn’t really make any sense anymore. We just decided that. You know, my paycheck as *** teacher would be better spent me being home. I was working in social work. I loved it. I would’ve stayed there forever, but it came to the point where I wasn’t making enough money in terms of paying for childcare. So what’s being done about this crisis? There are some spotty signs of progress. We’re estimating 4500 new spaces are gonna be opening up for children across the state, which we know we need. Last year, New Mexico launched free universal child care for kids from age 6 weeks to 13 years old. New York City will be launching universal child care for 2-year-olds this fall, and San Francisco raised income limits so more families qualify for help. But what can you do if relief still feels out of reach? Some parents are finding support through each other through nanny shares, in-home daycares, and babysitting co-ops. Others are tapping into dependent care FSAs, military childcare programs, and employee benefits. Some may offer subsidies. We have *** QR code up on the screen, so scan that to see what resources may be available where you live. Reporting in New York, I’m Ali Jasinski.
The cost of childcare has risen faster than inflation.From September 2024 to September 2025, childcare costs in the United States were up 5.2% — a rate that outpaced inflation by 1 1/2 times, according to a report from the Bank of America Institute. Nationwide, the average annual cost of full-time childcare for an infant at a center-based facility in the U.S. was about $15,500, according to 2024 data from Child Care Aware. That’s equal to almost $1,300 a month.The cost burden of childcare varies by income and by geography, too; for example, childcare is costliest in places like Massachusetts, Maryland and Washington, D.C., which also have a high median family income.Childcare costs are considered affordable when they are 7% of household income. Nationwide, the average for center-based childcare is about 15% of the median family income. The Get the Facts Data Team found what the cost burden is in every state using data from Child Care Aware. Use the interactive below to see how your state compares.Average childcare costs as a percentage of incomeThe rankings below show which states have the highest average cost of childcare for an infant at a center-based facility as a percentage of the median family income. In Hawaii, the average cost of childcare is nearly 22% of the median family income.Hawaii – 21.9%District of Columbia – 20.3%California – 20.3%New York – 19.6%Maryland – 19.6% Massachusetts – 19.2%Illinois – 18.5%Indiana – 18.3%Nebraska – 17.9%Rhode Island – 17.8%Oregon – 17.8%Wisconsin – 17.5%Washington – 17.2%Vermont – 17.0%Minnesota – 16.9%Colorado – 16.8%Arizona – 15.9%Delaware – 15.8%New Jersey – 15.3%Kentucky – 15.2%Connecticut – 15.2%Tennessee – 15.2%Kansas – 15.1%Montana – 15.0%Maine – 14.9%Ohio – 14.7%Missouri – 14.5%Florida – 14.4%Virginia – 14.4%Pennsylvania – 14.3%Michigan1 – 4.3%Wyoming – 14.2%Louisiana – 14.0%Oklahoma – 13.9%Nevada – 13.9%North Carolina – 13.4%Iowa – 13.1%West Virginia – 13.0%Utah – 12.2%Arkansas – 12.2%New Hampshire – 12.2%Texas – 12.1%South Carolina – 11.8%Georgia – 11.6%North Dakota – 11.6%Alaska – 11.0%Idaho – 10.6%Mississippi – 10.5%Alabama – 10.3%South Dakota – 8.5%
The cost of childcare has risen faster than inflation.
From September 2024 to September 2025, childcare costs in the United States were up 5.2% — a rate that outpaced inflation by 1 1/2 times, according to a report from the Bank of America Institute.
Nationwide, the average annual cost of full-time childcare for an infant at a center-based facility in the U.S. was about $15,500, according to 2024 data from Child Care Aware. That’s equal to almost $1,300 a month.
The cost burden of childcare varies by income and by geography, too; for example, childcare is costliest in places like Massachusetts, Maryland and Washington, D.C., which also have a high median family income.
Childcare costs are considered affordable when they are 7% of household income. Nationwide, the average for center-based childcare is about 15% of the median family income.
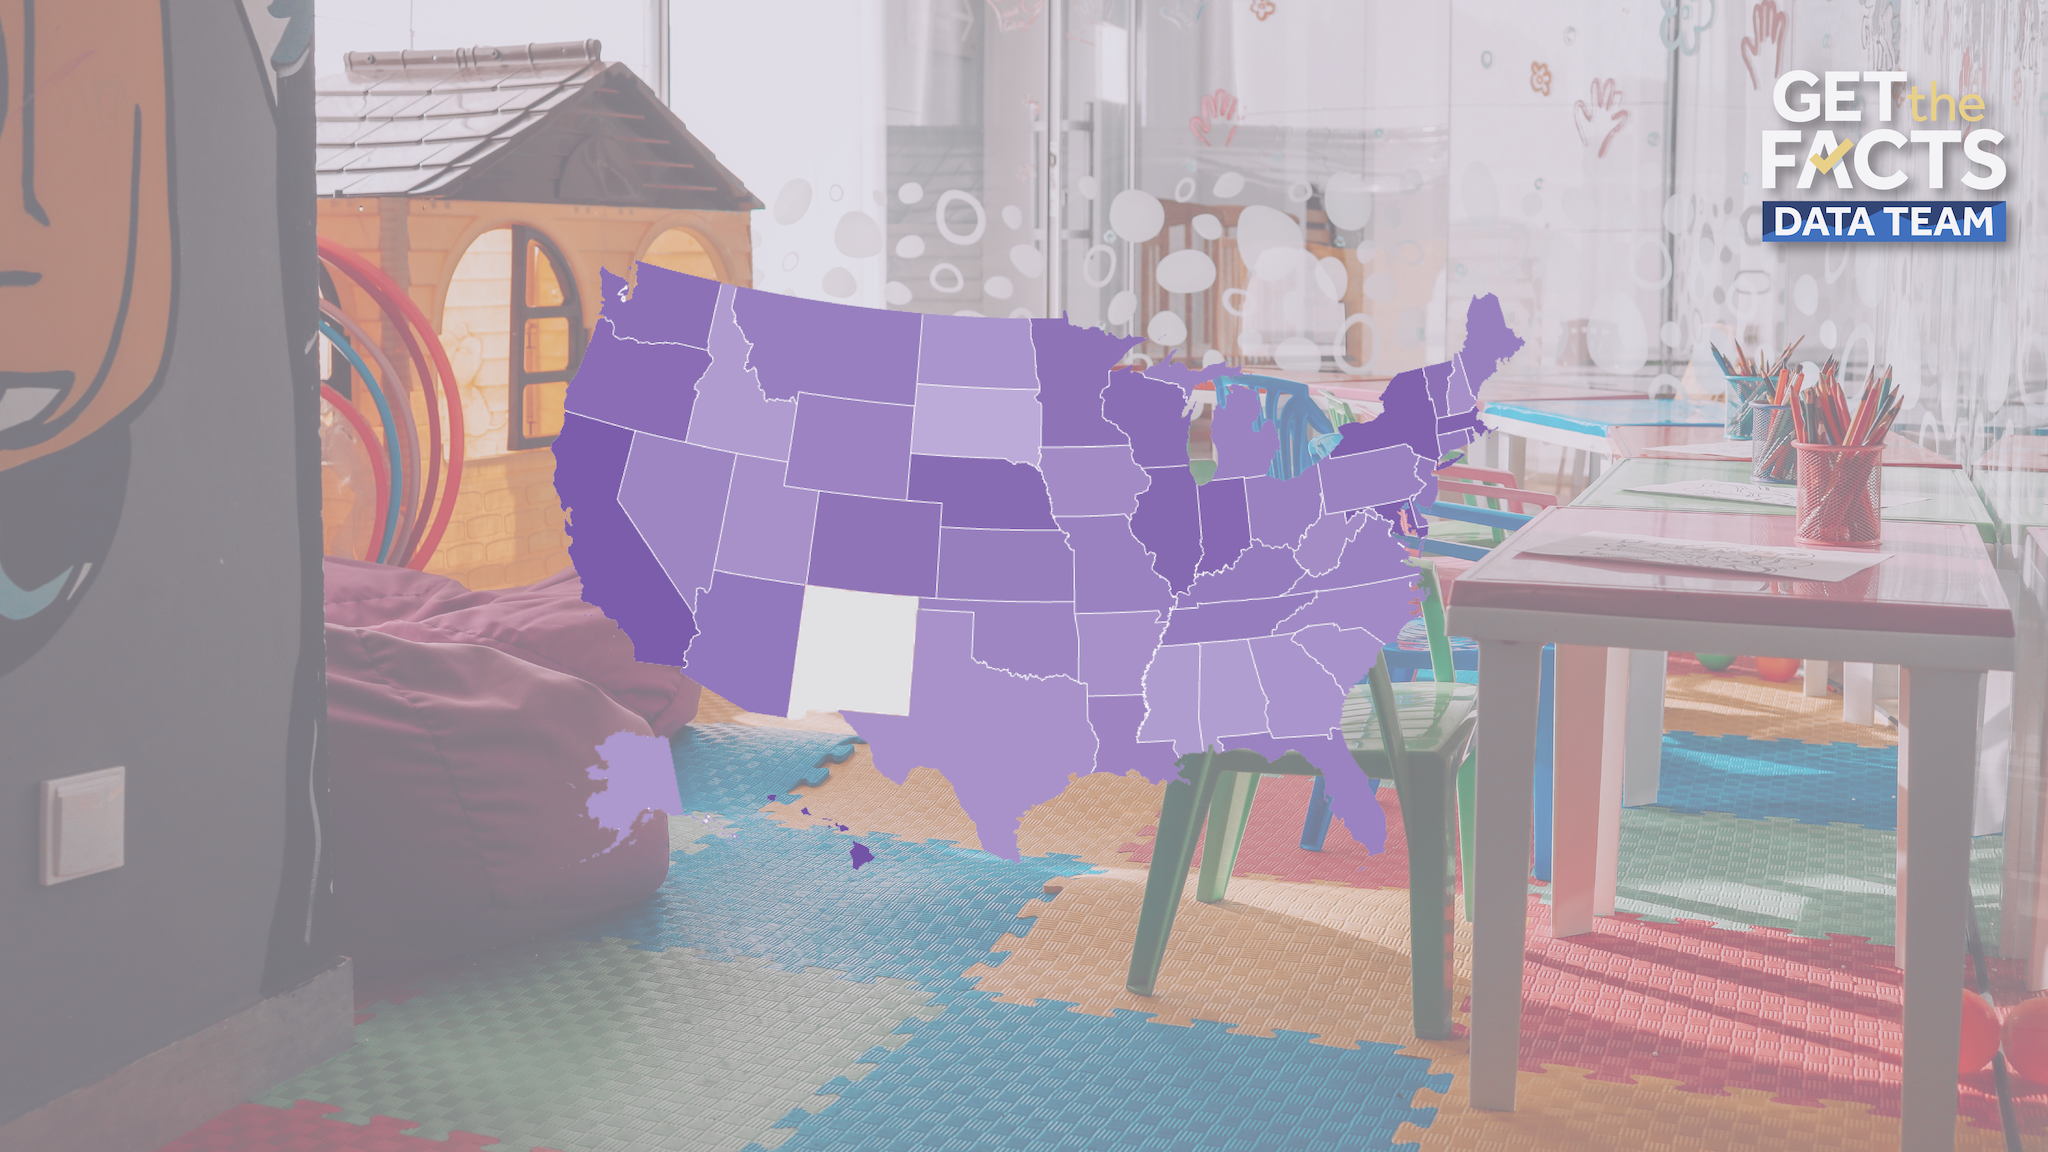
The Get the Facts Data Team found what the cost burden is in every state using data from Child Care Aware. Use the interactive below to see how your state compares.
Average childcare costs as a percentage of income
The rankings below show which states have the highest average cost of childcare for an infant at a center-based facility as a percentage of the median family income. In Hawaii, the average cost of childcare is nearly 22% of the median family income.
- Hawaii – 21.9%
- District of Columbia – 20.3%
- California – 20.3%
- New York – 19.6%
- Maryland – 19.6%
- Massachusetts – 19.2%
- Illinois – 18.5%
- Indiana – 18.3%
- Nebraska – 17.9%
- Rhode Island – 17.8%
- Oregon – 17.8%
- Wisconsin – 17.5%
- Washington – 17.2%
- Vermont – 17.0%
- Minnesota – 16.9%
- Colorado – 16.8%
- Arizona – 15.9%
- Delaware – 15.8%
- New Jersey – 15.3%
- Kentucky – 15.2%
- Connecticut – 15.2%
- Tennessee – 15.2%
- Kansas – 15.1%
- Montana – 15.0%
- Maine – 14.9%
- Ohio – 14.7%
- Missouri – 14.5%
- Florida – 14.4%
- Virginia – 14.4%
- Pennsylvania – 14.3%
- Michigan1 – 4.3%
- Wyoming – 14.2%
- Louisiana – 14.0%
- Oklahoma – 13.9%
- Nevada – 13.9%
- North Carolina – 13.4%
- Iowa – 13.1%
- West Virginia – 13.0%
- Utah – 12.2%
- Arkansas – 12.2%
- New Hampshire – 12.2%
- Texas – 12.1%
- South Carolina – 11.8%
- Georgia – 11.6%
- North Dakota – 11.6%
- Alaska – 11.0%
- Idaho – 10.6%
- Mississippi – 10.5%
- Alabama – 10.3%
- South Dakota – 8.5%