There were 31 states that had population gains due to more people moving in from other states last year, according to new data from the U.S. Census Bureau.The Vintage 2025 population estimates released in January detailed population changes in 2025, including domestic and international migration trends. Nationwide, population growth has slowed due to a drop in international migration.Several states saw population growth from people moving there from other states – a component called “domestic migration.”South Carolina had the fastest-growing population, according to the new data. It increased at a rate of 1.5% from data collected in 2024 to 2025, growth driven by domestic migration, according to the U.S. Census Bureau. South Carolina also had the highest rate of domestic migration growth as of 2025. Net domestic migration takes the difference between the number of people who moved into the state and the number who moved out of the state. A positive number indicates more people are moving there, while a negative number reflects migration to other states.The net domestic migration rate was 12 people per 1,000. Viewing net domestic migration as a rate allows for an accurate comparison between states. Behind South Carolina were Idaho and North Carolina, which had positive net domestic migration rates of 9.9 and 7.6 people per 1,000. Both states also saw some of the largest increases in population, also driven by domestic migration.The remaining 20 states, which include Washington, D.C., saw negative net domestic migration rates, meaning more people moved to other states than moved in. New York had the largest rate of negative net domestic migration, with a negative rate of 6.9 per 1,000 people. Behind New York were Hawaii and Alaska.When looking at overall net domestic migration, North Carolina had the highest at more than 84,064. California had the highest negative net domestic migration at 229,077.PHNjcmlwdCB0eXBlPSJ0ZXh0L2phdmFzY3JpcHQiPiFmdW5jdGlvbigpeyJ1c2Ugc3RyaWN0Ijt3aW5kb3cuYWRkRXZlbnRMaXN0ZW5lcigibWVzc2FnZSIsKGZ1bmN0aW9uKGUpe2lmKHZvaWQgMCE9PWUuZGF0YVsiZGF0YXdyYXBwZXItaGVpZ2h0Il0pe3ZhciB0PWRvY3VtZW50LnF1ZXJ5U2VsZWN0b3JBbGwoImlmcmFtZSIpO2Zvcih2YXIgYSBpbiBlLmRhdGFbImRhdGF3cmFwcGVyLWhlaWdodCJdKWZvcih2YXIgcj0wO3I8dC5sZW5ndGg7cisrKXtpZih0W3JdLmNvbnRlbnRXaW5kb3c9PT1lLnNvdXJjZSl0W3JdLnN0eWxlLmhlaWdodD1lLmRhdGFbImRhdGF3cmFwcGVyLWhlaWdodCJdW2FdKyJweCJ9fX0pKX0oKTs8L3NjcmlwdD4=
There were 31 states that had population gains due to more people moving in from other states last year, according to new data from the U.S. Census Bureau.
The Vintage 2025 population estimates released in January detailed population changes in 2025, including domestic and international migration trends. Nationwide, population growth has slowed due to a drop in international migration.
Several states saw population growth from people moving there from other states – a component called “domestic migration.”
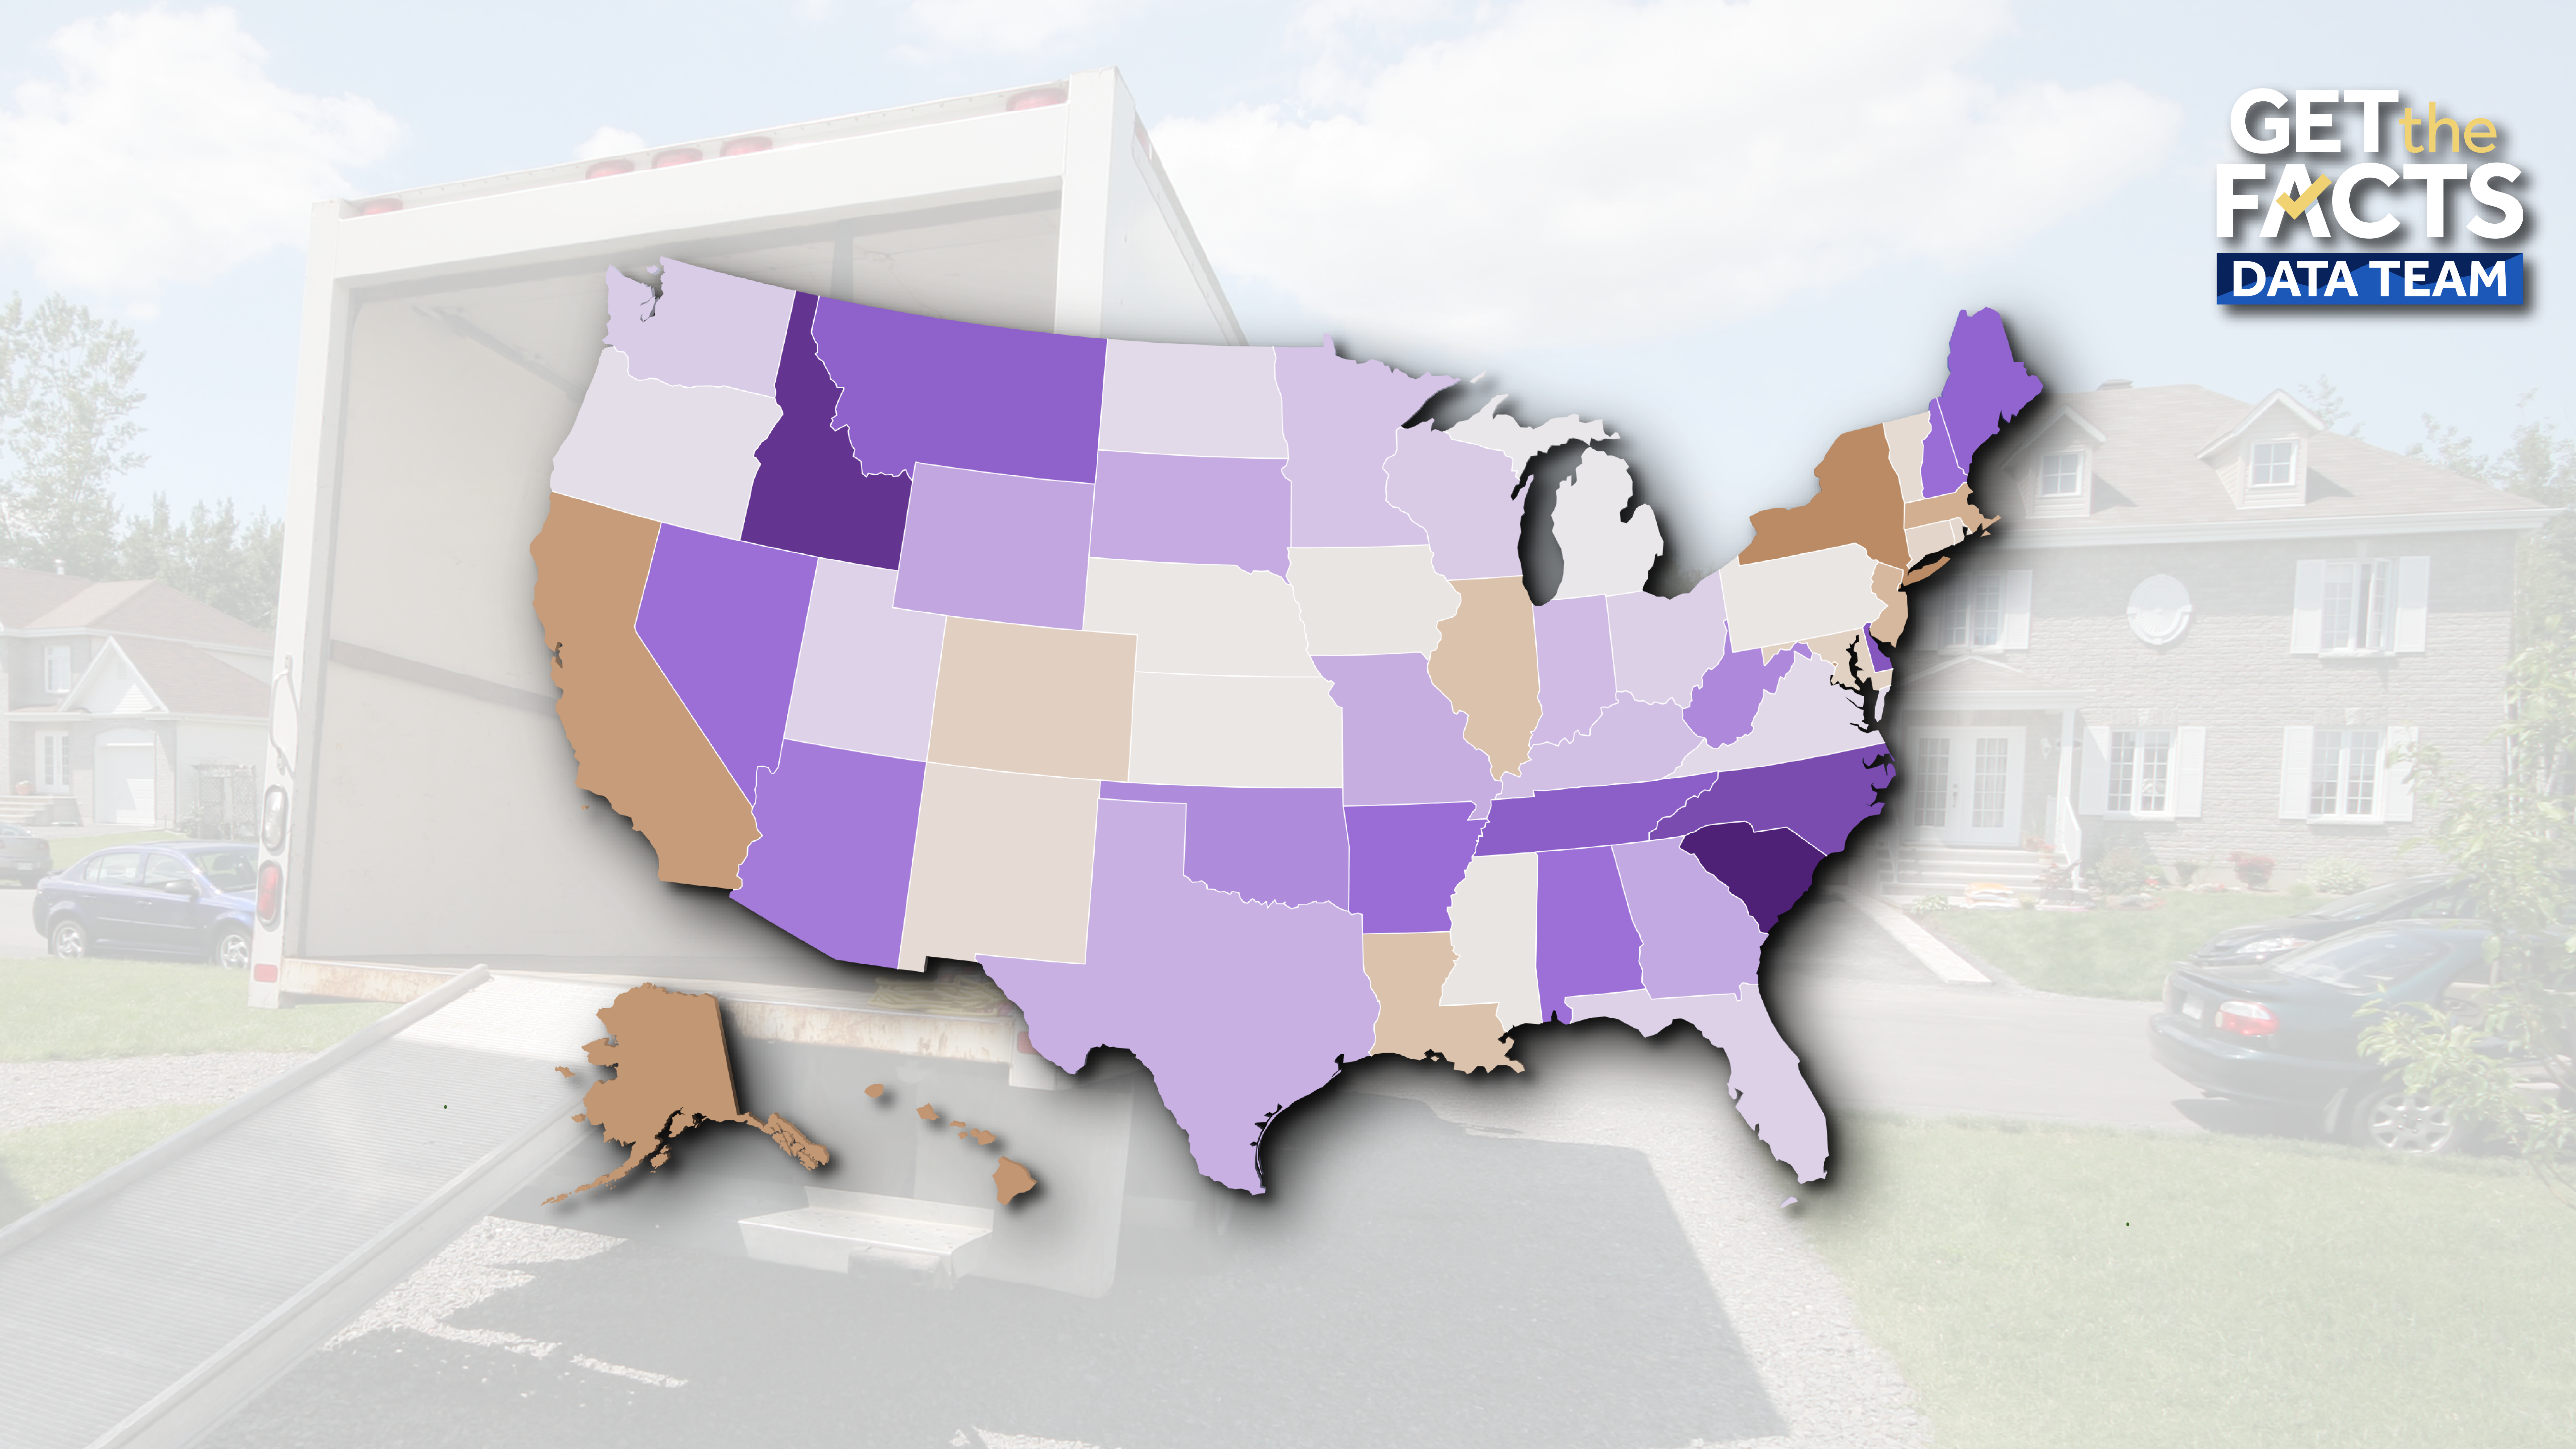
South Carolina had the fastest-growing population, according to the new data. It increased at a rate of 1.5% from data collected in 2024 to 2025, growth driven by domestic migration, according to the U.S. Census Bureau.
South Carolina also had the highest rate of domestic migration growth as of 2025. Net domestic migration takes the difference between the number of people who moved into the state and the number who moved out of the state. A positive number indicates more people are moving there, while a negative number reflects migration to other states.
The net domestic migration rate was 12 people per 1,000. Viewing net domestic migration as a rate allows for an accurate comparison between states.
Behind South Carolina were Idaho and North Carolina, which had positive net domestic migration rates of 9.9 and 7.6 people per 1,000. Both states also saw some of the largest increases in population, also driven by domestic migration.
The remaining 20 states, which include Washington, D.C., saw negative net domestic migration rates, meaning more people moved to other states than moved in.
New York had the largest rate of negative net domestic migration, with a negative rate of 6.9 per 1,000 people. Behind New York were Hawaii and Alaska.
When looking at overall net domestic migration, North Carolina had the highest at more than 84,064. California had the highest negative net domestic migration at 229,077.